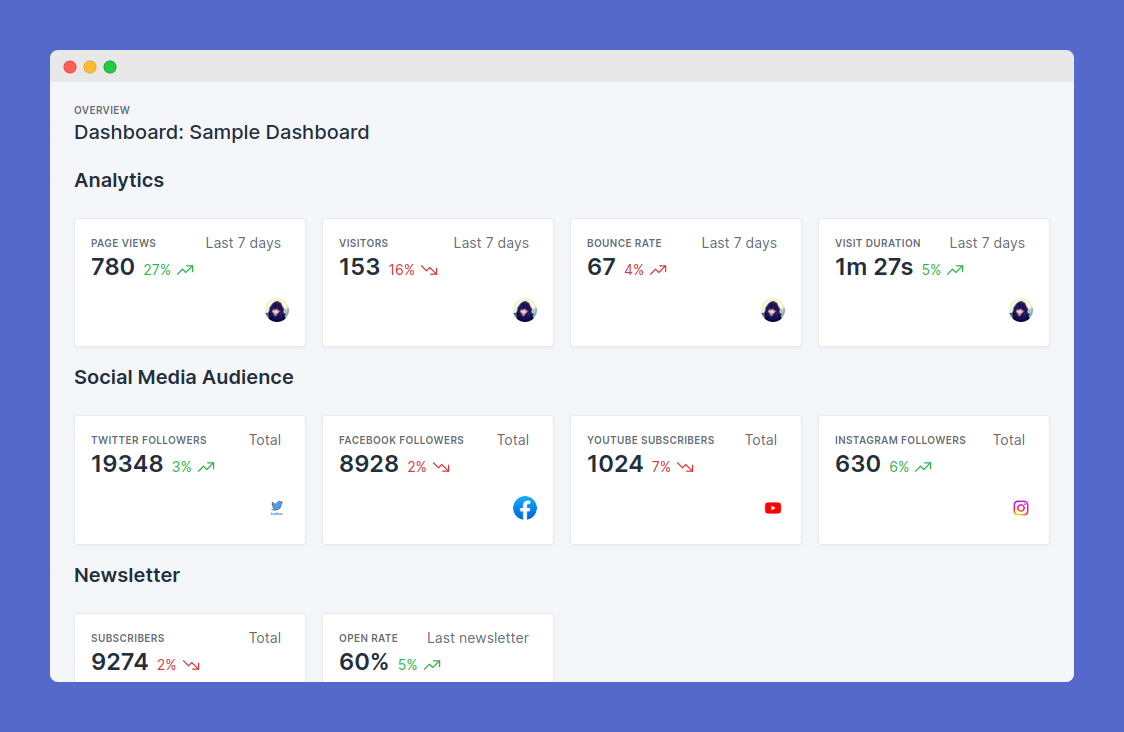
A headless statistics dashboard.

Concept
Statistics can come from any number of sources and often we want to combine statistics from multiple sources into a single report. For example, a company looking to sponsor your website or newsletter might want to know
- How many website visitors do you get per month?
- What is the average time spent on the site?
- How big a following do you have on Twitter, Facebook, Instagram etc?
- What is your newsletter open rate?
- How many subscribers does it go to?
- etc etc
Gathering and maintaining all this information can be rather time-consuming and repetitive so why not automate it? With Statisfy you can create dashboards and configure them to show any statistics you desire.
- Our connectors allow you to "connect" your dashboard to your service providers i.e. Google Analytics, Twitter, MailChimp and we can update the statistics on a defined interval.
- With our API, you can calculate your statistics offline via any mechanism you desire and then push the desired value to your dashboard.
- And our manual updates lets you enter statistics you can't automate
You can use one or all of methods above on a Statisfy dashboard so you can report on anything - website statistics, revenue, call and resolution times or even your company's fantasy football league or fitbit challenge.